Kelly Halverson Asks Which IUL Would Your Client Rather Have?
 8 min read

The indexed universal life market has been a tricky one to navigate these past few years with AG49, AG49A and the revision to AG49A. History kept repeating itself as state regulators tried to address concerns raised by state insurance regulators when new IUL product features were released. The industry responded with more creative designs, innovative features and thought leadership to differentiate their products. With each new regulation came hurdles that companies needed to find a way over, around or through.
At Ameritas, we decided to go over those hurdles, sticking to the spirit and letter of the illustration regulations as best we could. As a result, when you stack us up against the “innovative” competition, we have a tough time articulating our value when going toe-to-toe in the illustration wars. The ground we are paving today isn’t that different than the ground I covered almost a decade ago, when the NAIC clarified some illustration rules with the original AG49 in the summer of 2015.
The year was 2015, my hair thicker and less gray, and our IUL shelf was considerably less cluttered. I was preparing to address our field force and compare ourselves to one of the most successful IUL writers in the industry, I’ll call them Company A, who was offering an illustration where they could’ve used MC Hammer as their spokesperson – “can’t touch this.”
I put together the following competitive comparison for a disciplined $1,000 a month illustration war for a 27-year-old, savings-minded young man in great health, with plans to build the ultimate retirement nest egg.
Comparison on August 2015
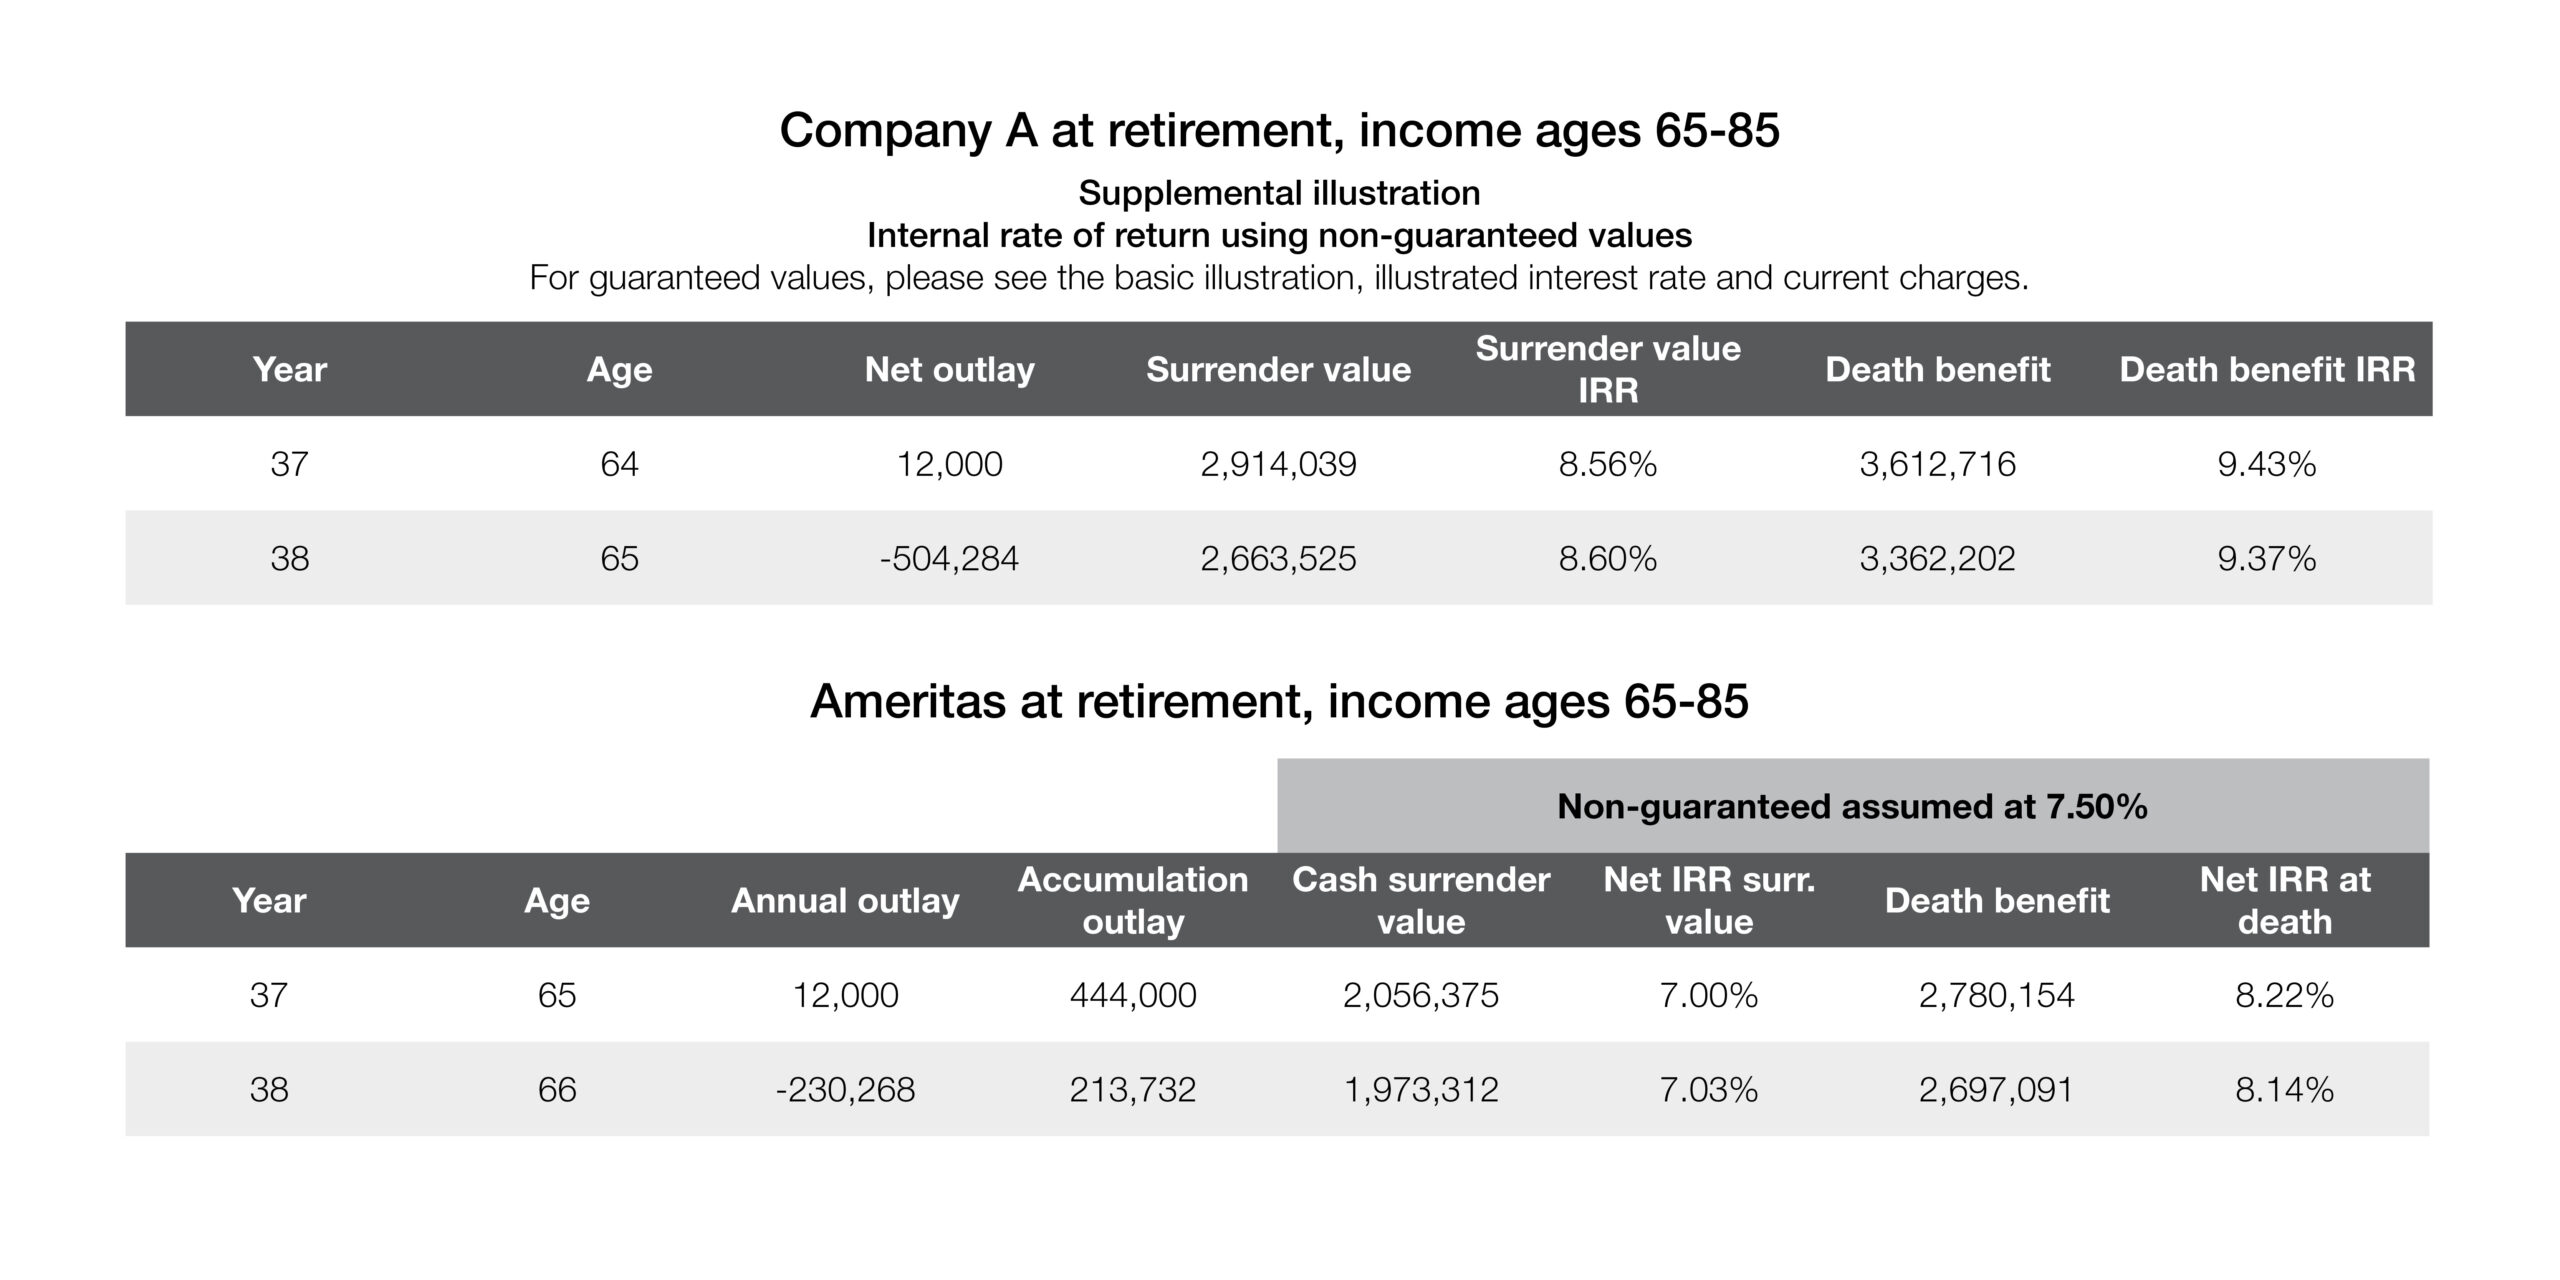
We were severely outgunned, but why? Company A was illustrating 9% growth on their account value while Ameritas offered a meager 7.5% illustrated rate. How could Company A turn a $2.9 million account value at 65 into $504,000 per year, while our $2.06 million account value could only accomplish $230,000? Because of one simple word, arbitrage. Company A was illustrating loans charging 4.25% while Ameritas was charging 4.3%, basically a wash. The difference comes down to the growth rate on loaned account value. While our illustrated rate was 7.5%, we chose to limit illustrated loan performance to 2%, meaning we throttled back illustrated loaned account value growth from 7.5% to 6.3%, resulting in a maximum 2% arbitrage on loaned values. Company A kept that 9% illustrated rate on both the loaned and unloaned account value, resulting in an eyewatering 475 basis points of loan arbitrage. The more you borrow, the more you can make, sign me up.
We observed the regulators catching wind of the reliance on loan leverage to juice illustrated performance. Their concern resulted in the implementing of the standardized approach to illustrated rate back-testing on September 1, 2015, and both companies had to pull back a bit.
Comparison on September 1, 2015

If you were on the fence, considering buying the Ameritas and Company A products on August 31 and you called your agent back on September 1, you were in for a shock. No change in the product, the cap rate, the charges or the actual anticipated performance could have more impact than the new back testing rules. That’s what caused Company A’s product to lose more than half of their illustrated income and Ameritas’ to drop 18%. This was just step one. Step two in March 2016 was to limit loan arbitrage to a maximum of 100 basis points.
Comparison on March 1, 2016
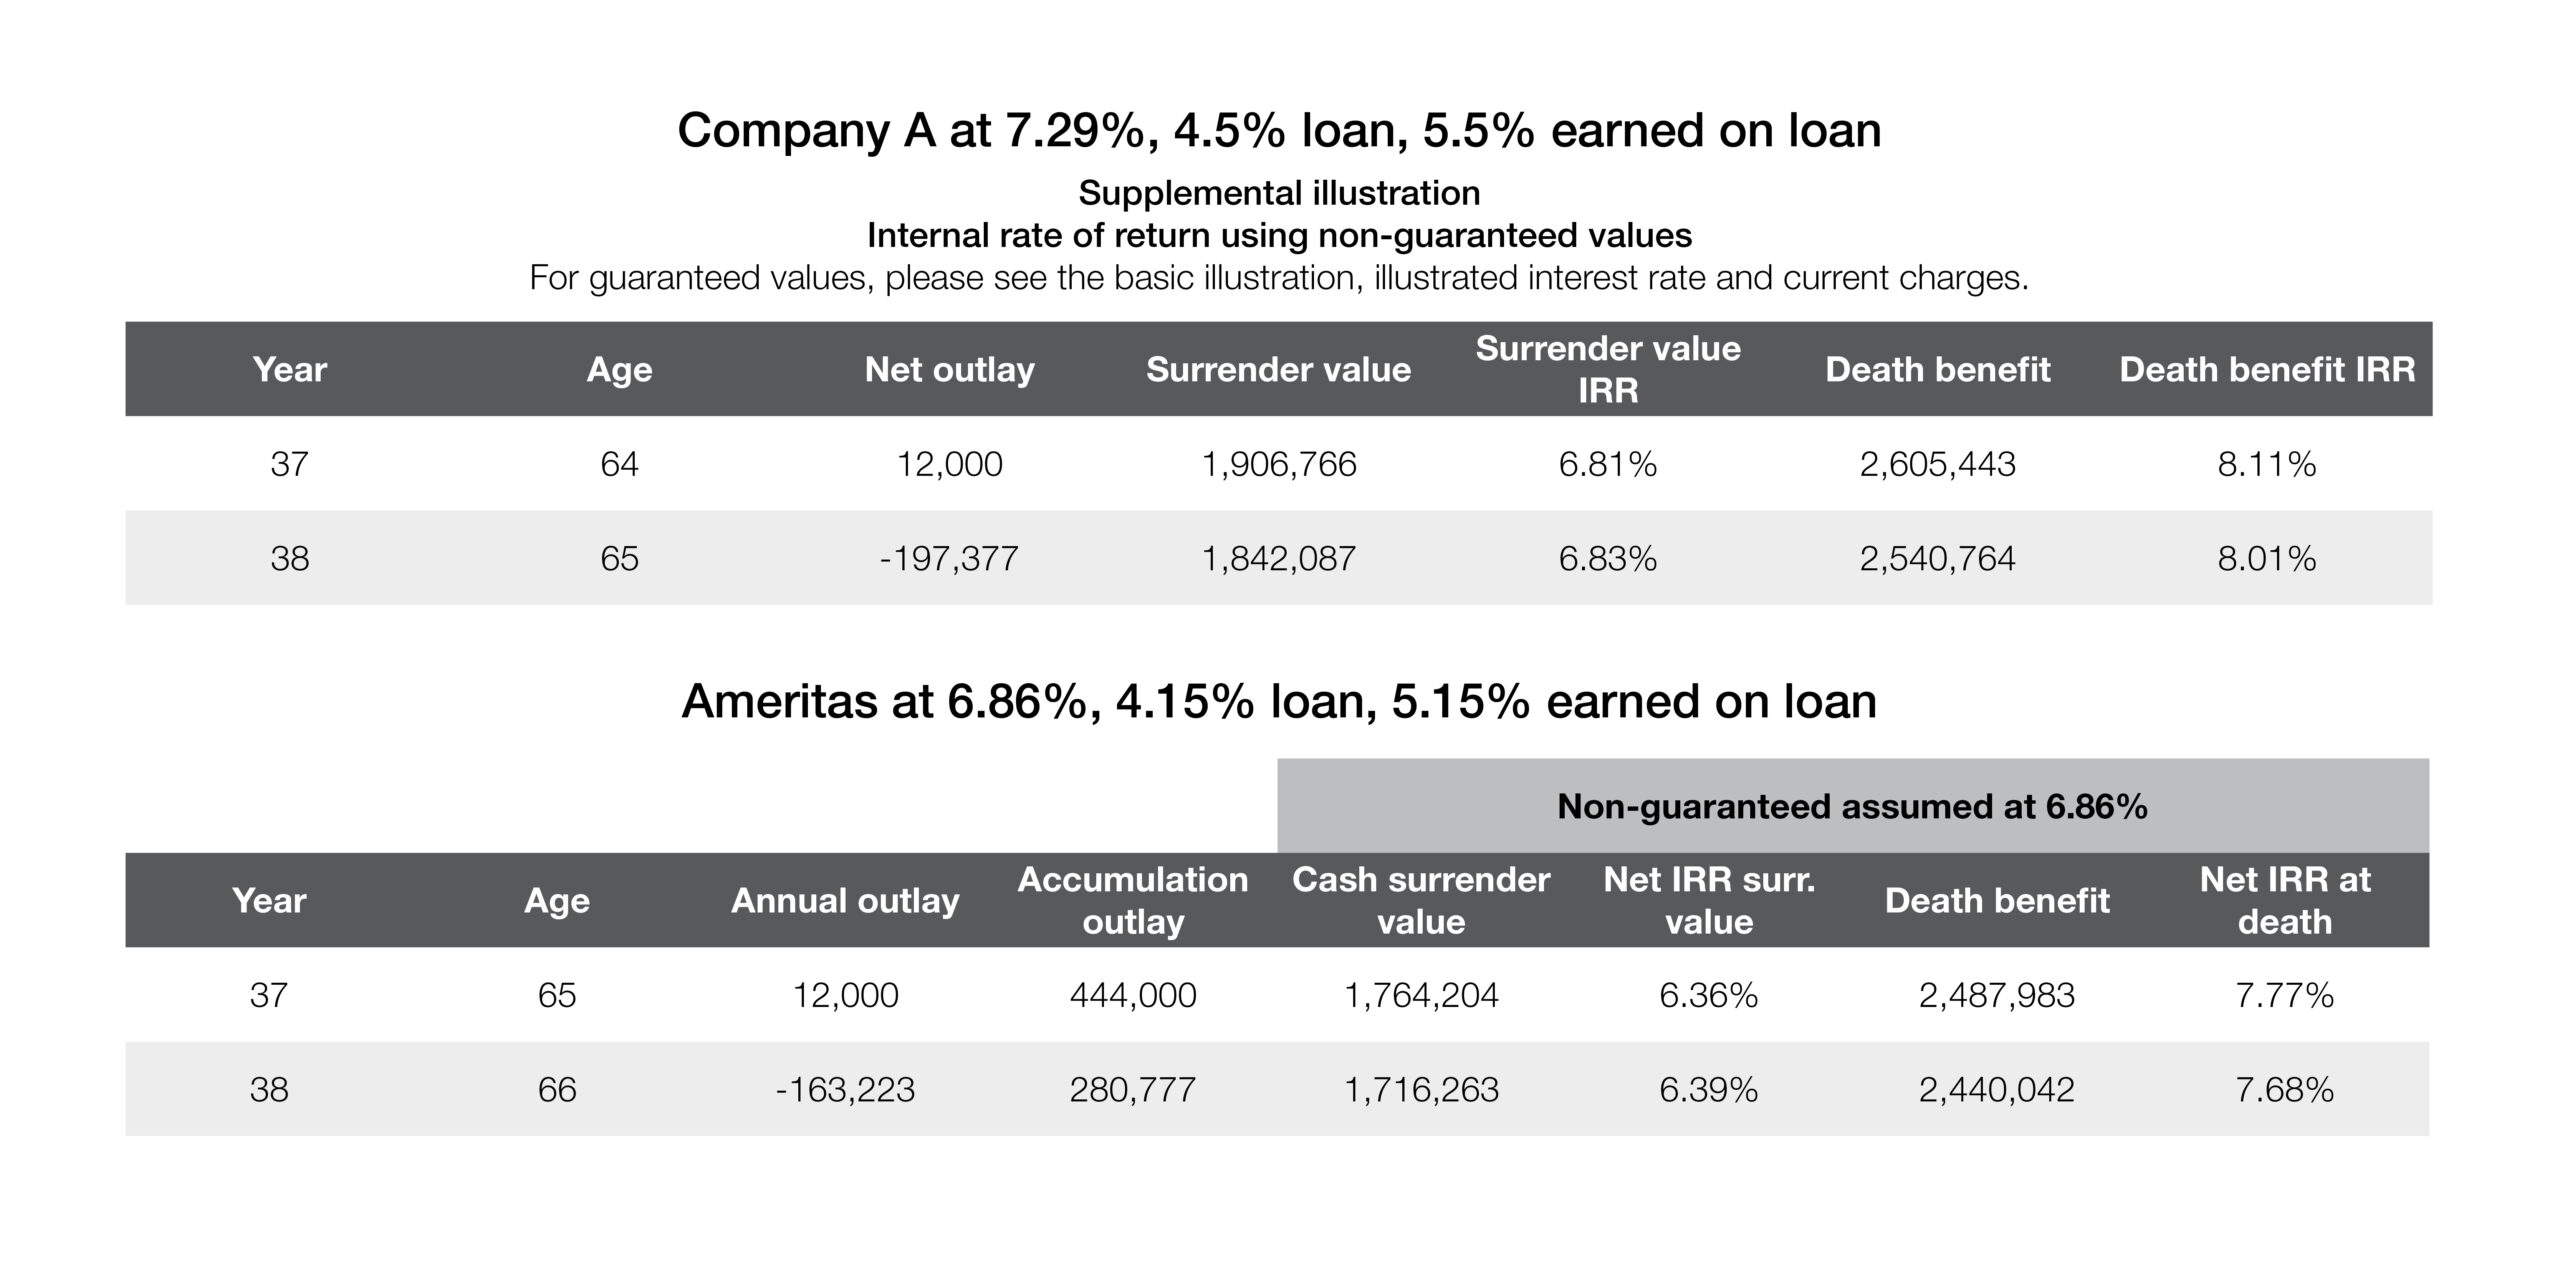
Ouch, another $50,000 of Company A illustrated income evaporated in six months with no change to underlying economics or expected product performance, and Ameritas dropped another 13%.
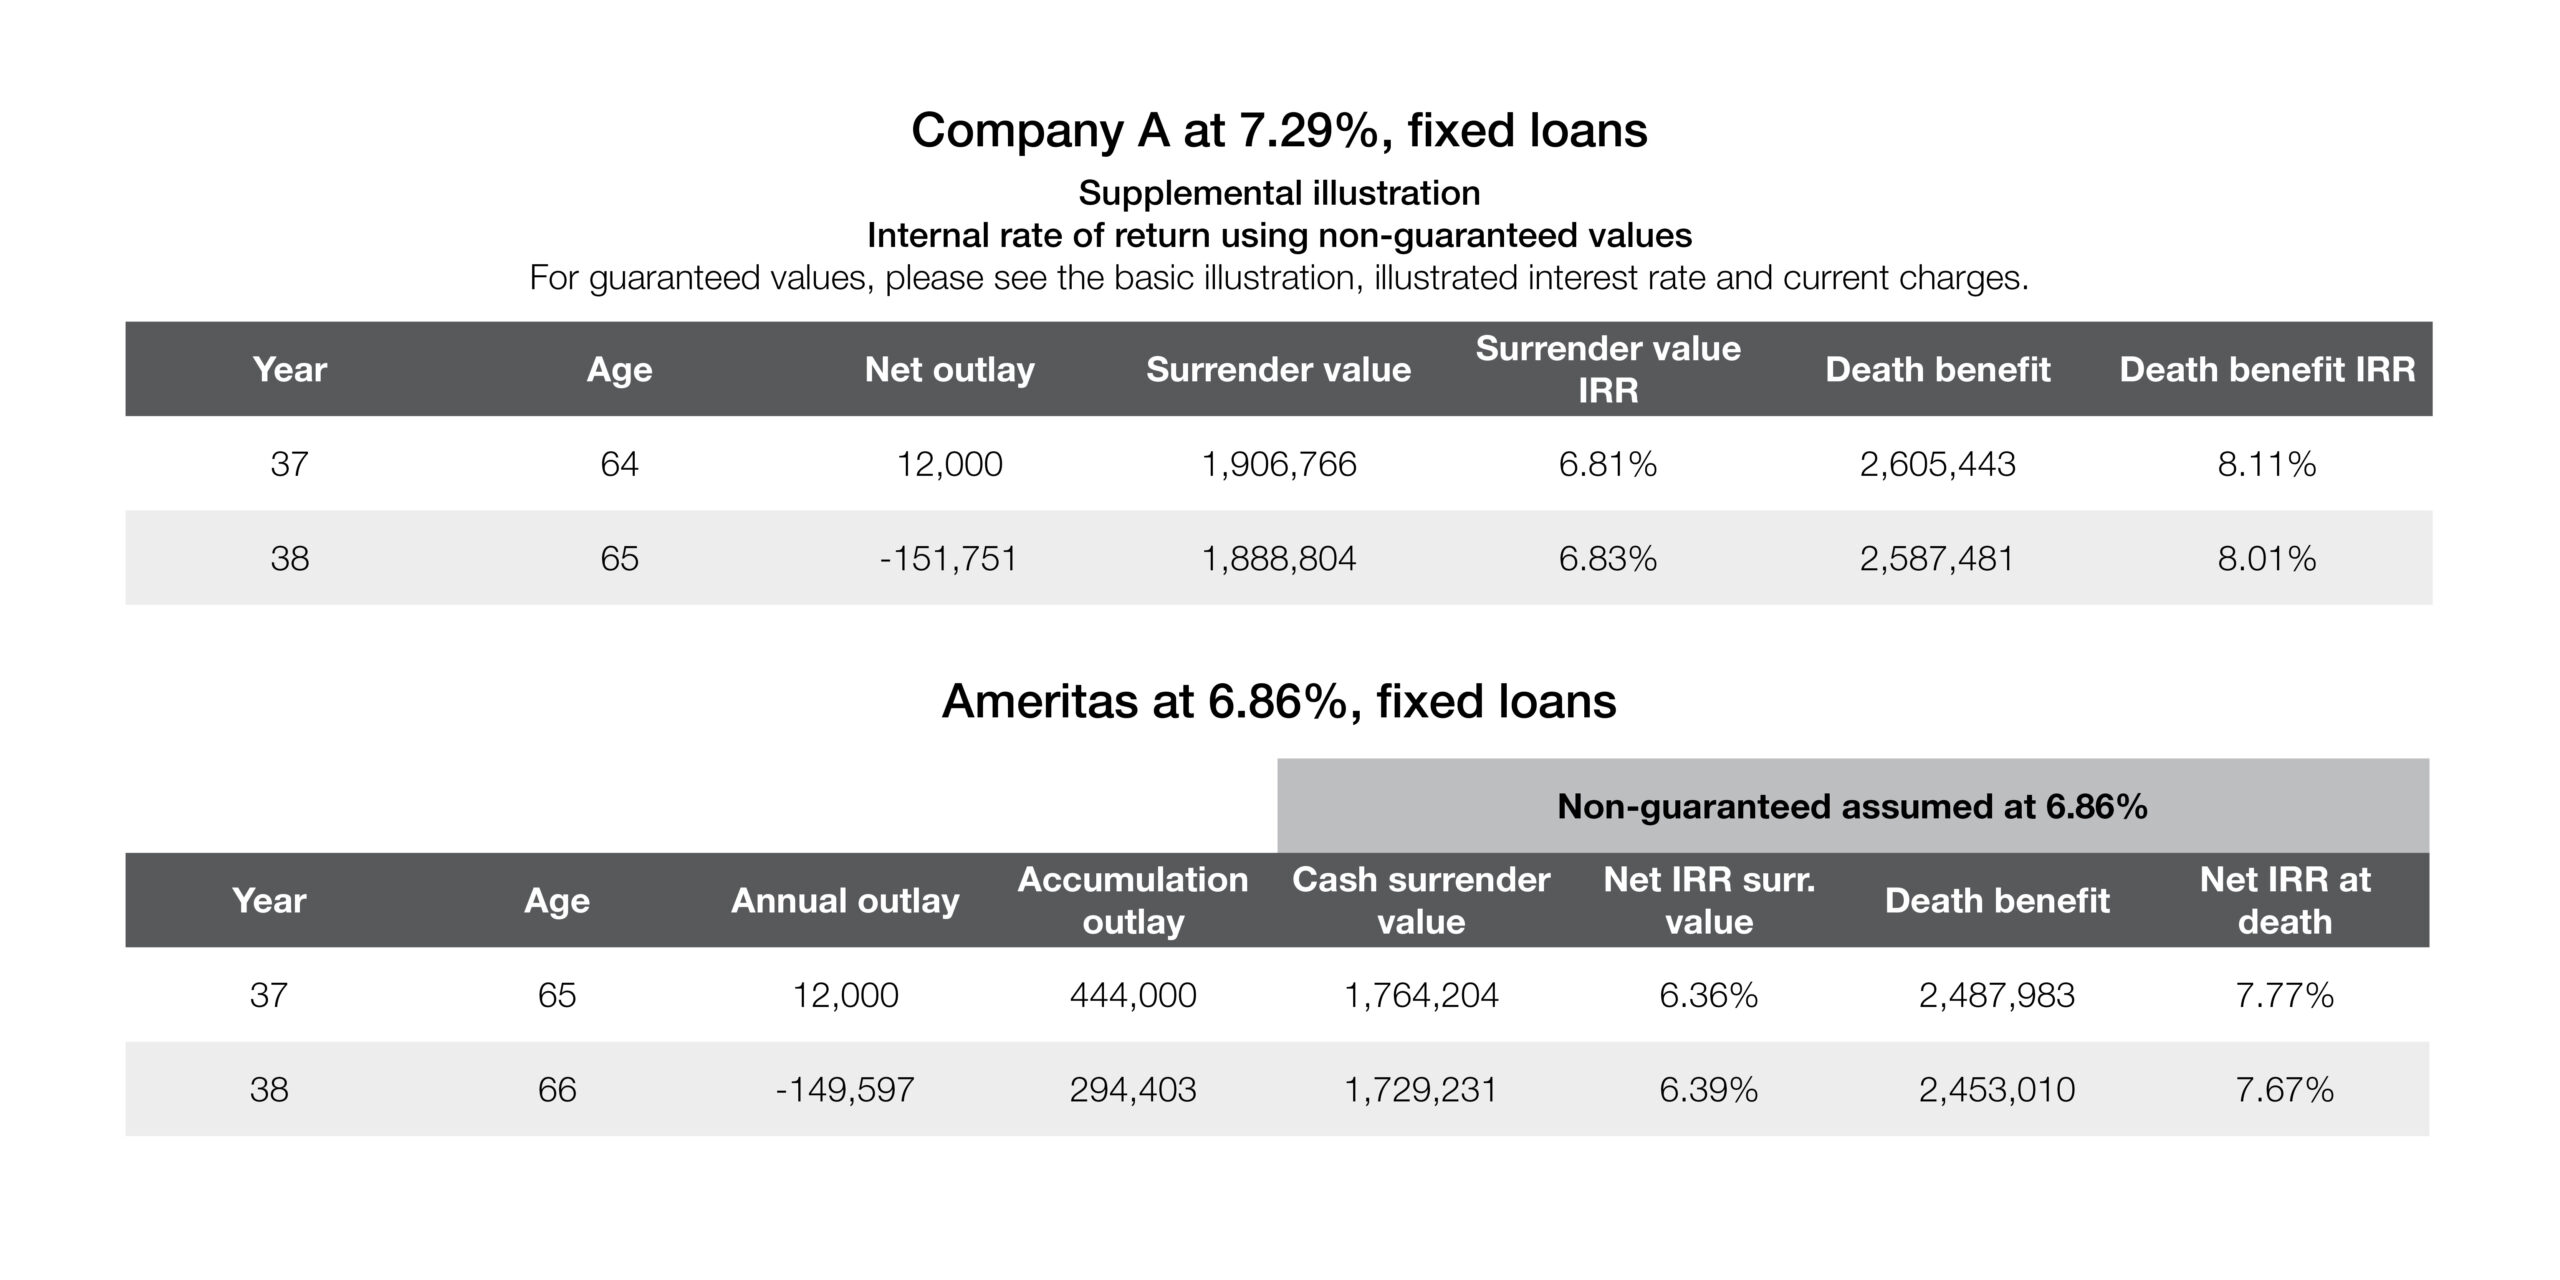
Fixed loan comparison
Let’s wipe those games off the page and focus on the fixed loan options. With that lens, our products are a coin flip, with the edge to the slightly better cap and illustrated rate offered by Company A.
Why are we taking this trip down memory lane? As I said earlier, history repeats itself, and we are again facing creative designs that are focused on winning the illustration war at the expense of delivering long term value. Fast forward to June 2023, when companies like Ameritas and Company A saw huge drops in first quarter IUL sales, as now we were both not pushing the envelopes of the illustration wars. How did we proceed? Ameritas held the line while Company A settled on the “if you can’t beat ‘em join em” strategy. What do I mean by this? Let’s look back at the products discussed above from way back in 2015.
In August 2023, faced with the reality of a hyper competitive illustrated rate environment, Company A succumbed. Let’s start with the client who bought the $500,000 income illustration in 2015.
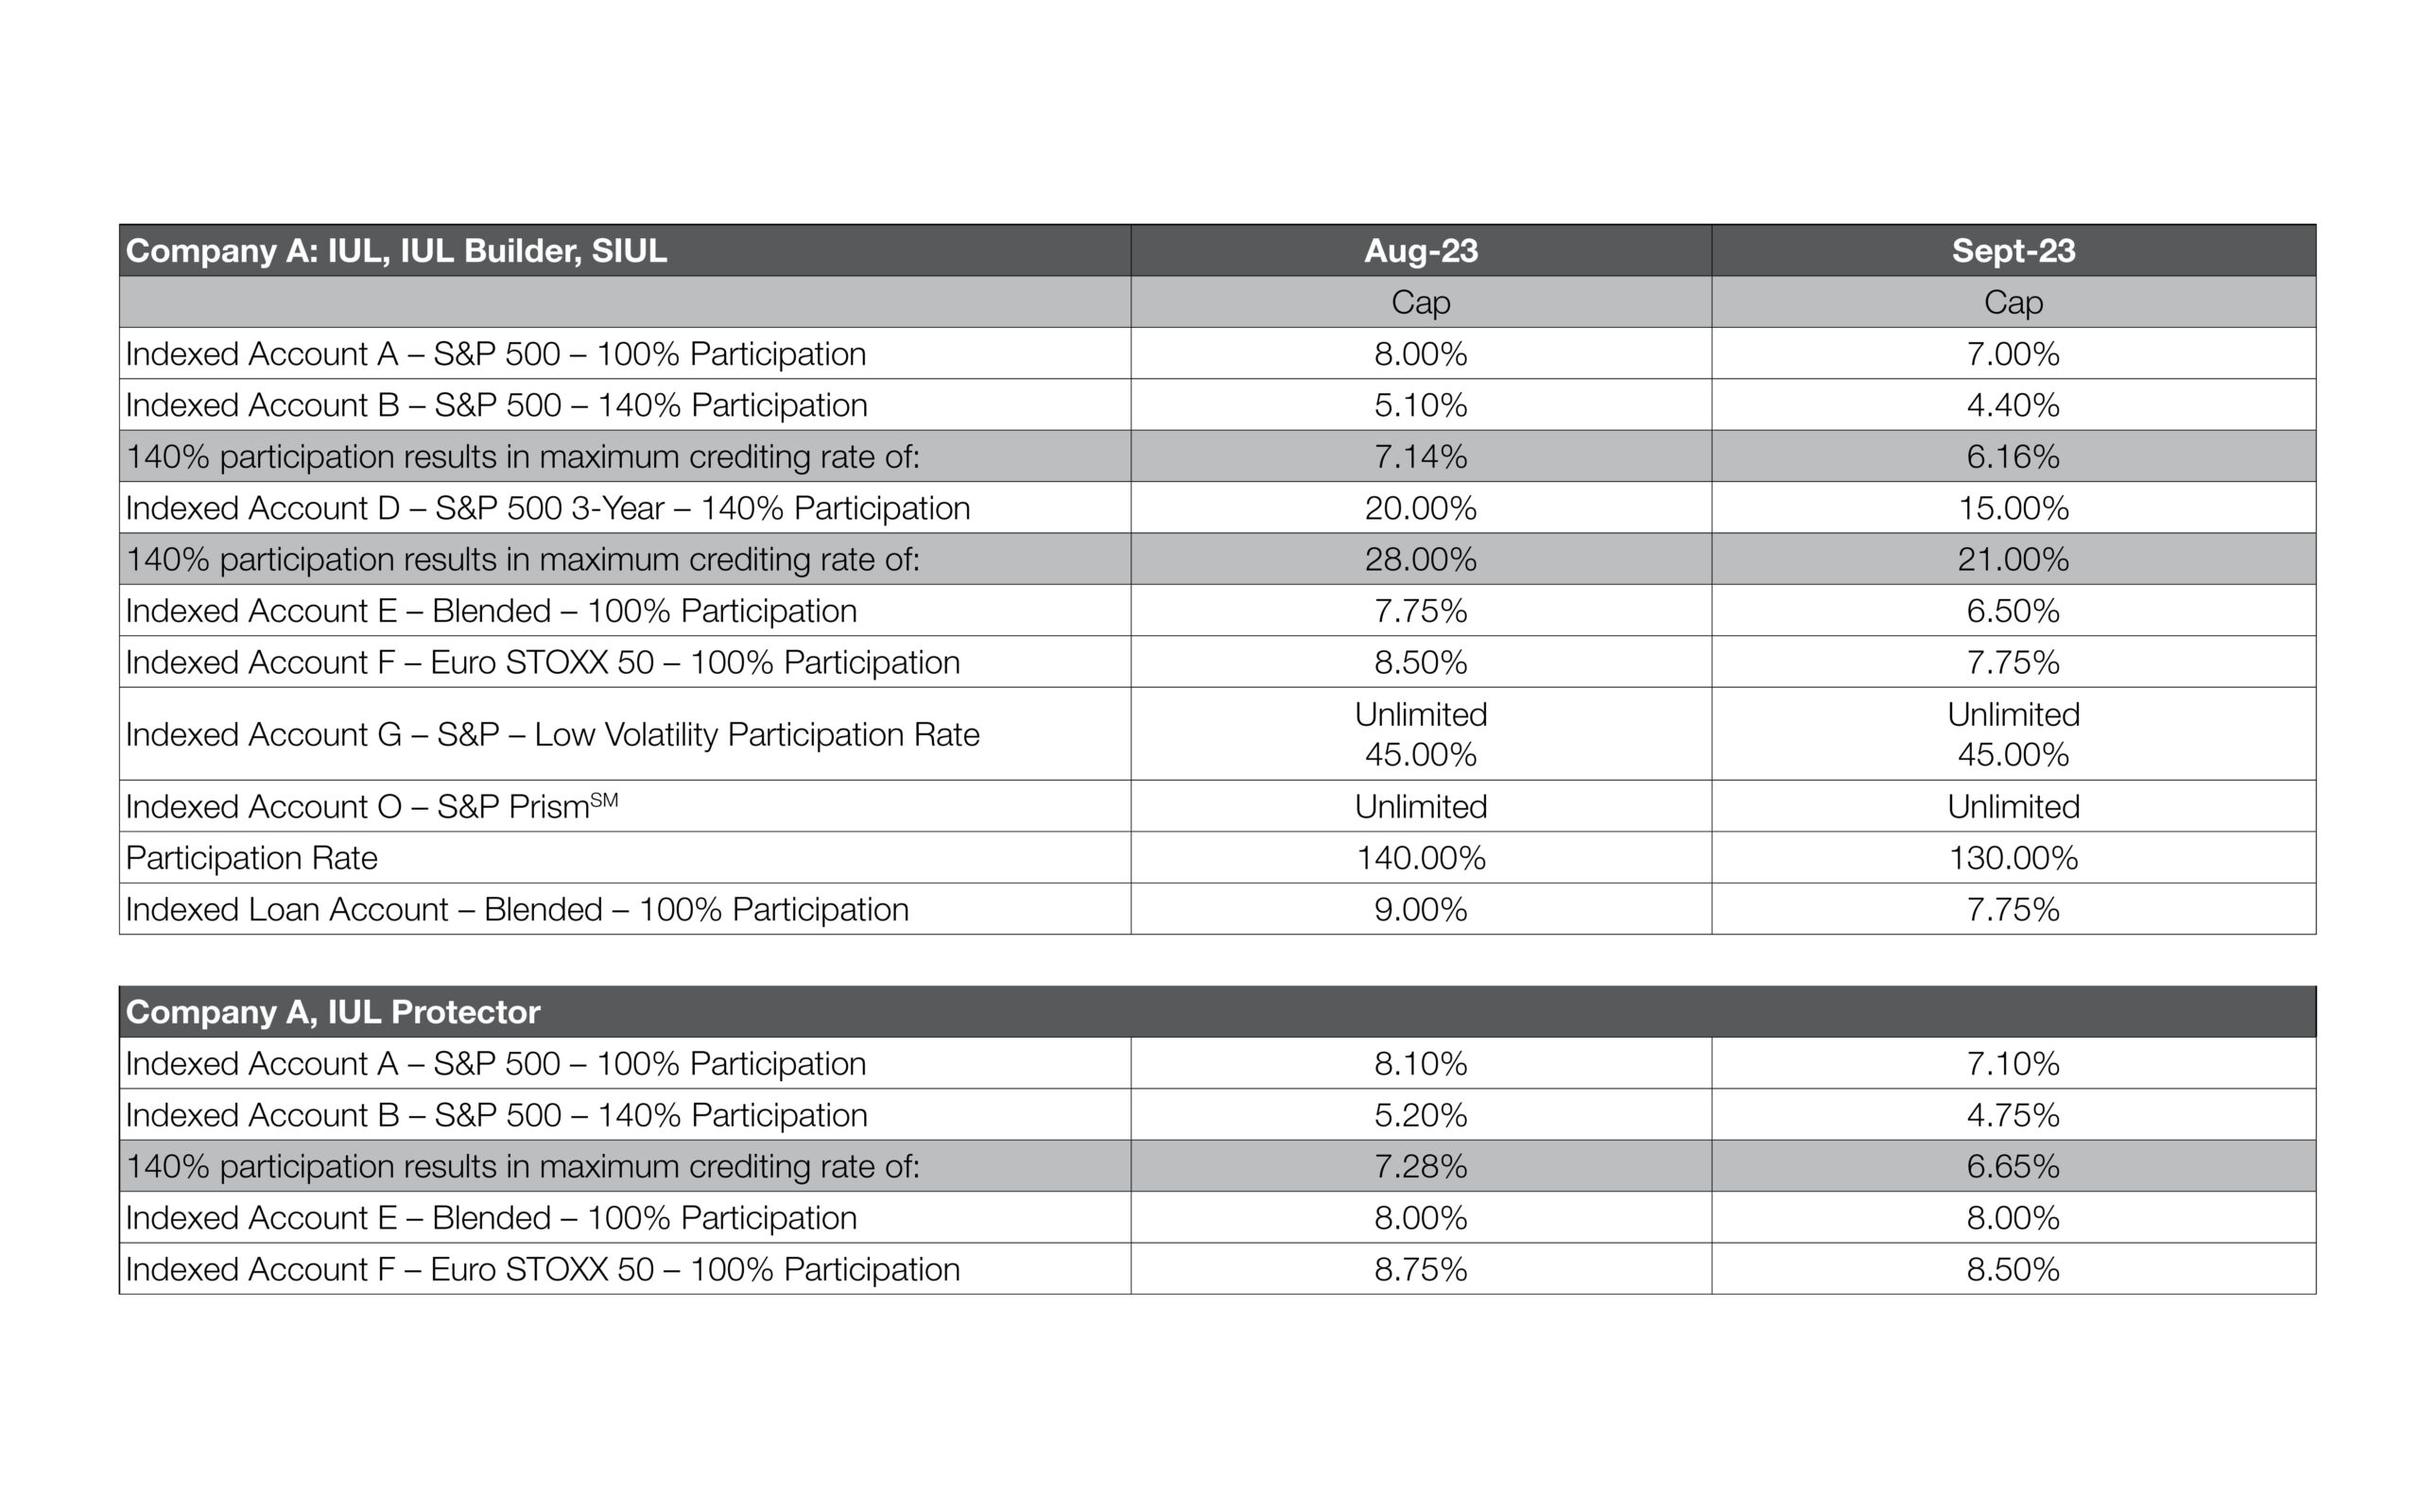
I don’t have line of sight to all the specific illustrated rates, but I can tell you the 7.1% cap shown for IUL Protector is illustrated at 4.69%. That is quite a drop from the 9% illustrated rate that this client expected every year for the next 75 years, it’s a 431 basis-point hit to illustrated performance. Will this now 35-year-old, disciplined saver still be counting on their IUL to kick off $500,000 per year in retirement income? Let’s hope not. Bad news indeed for existing clients, but great news for prospective clients, right? Because, after September 2023, new clients are buying the IUL Accumulator.
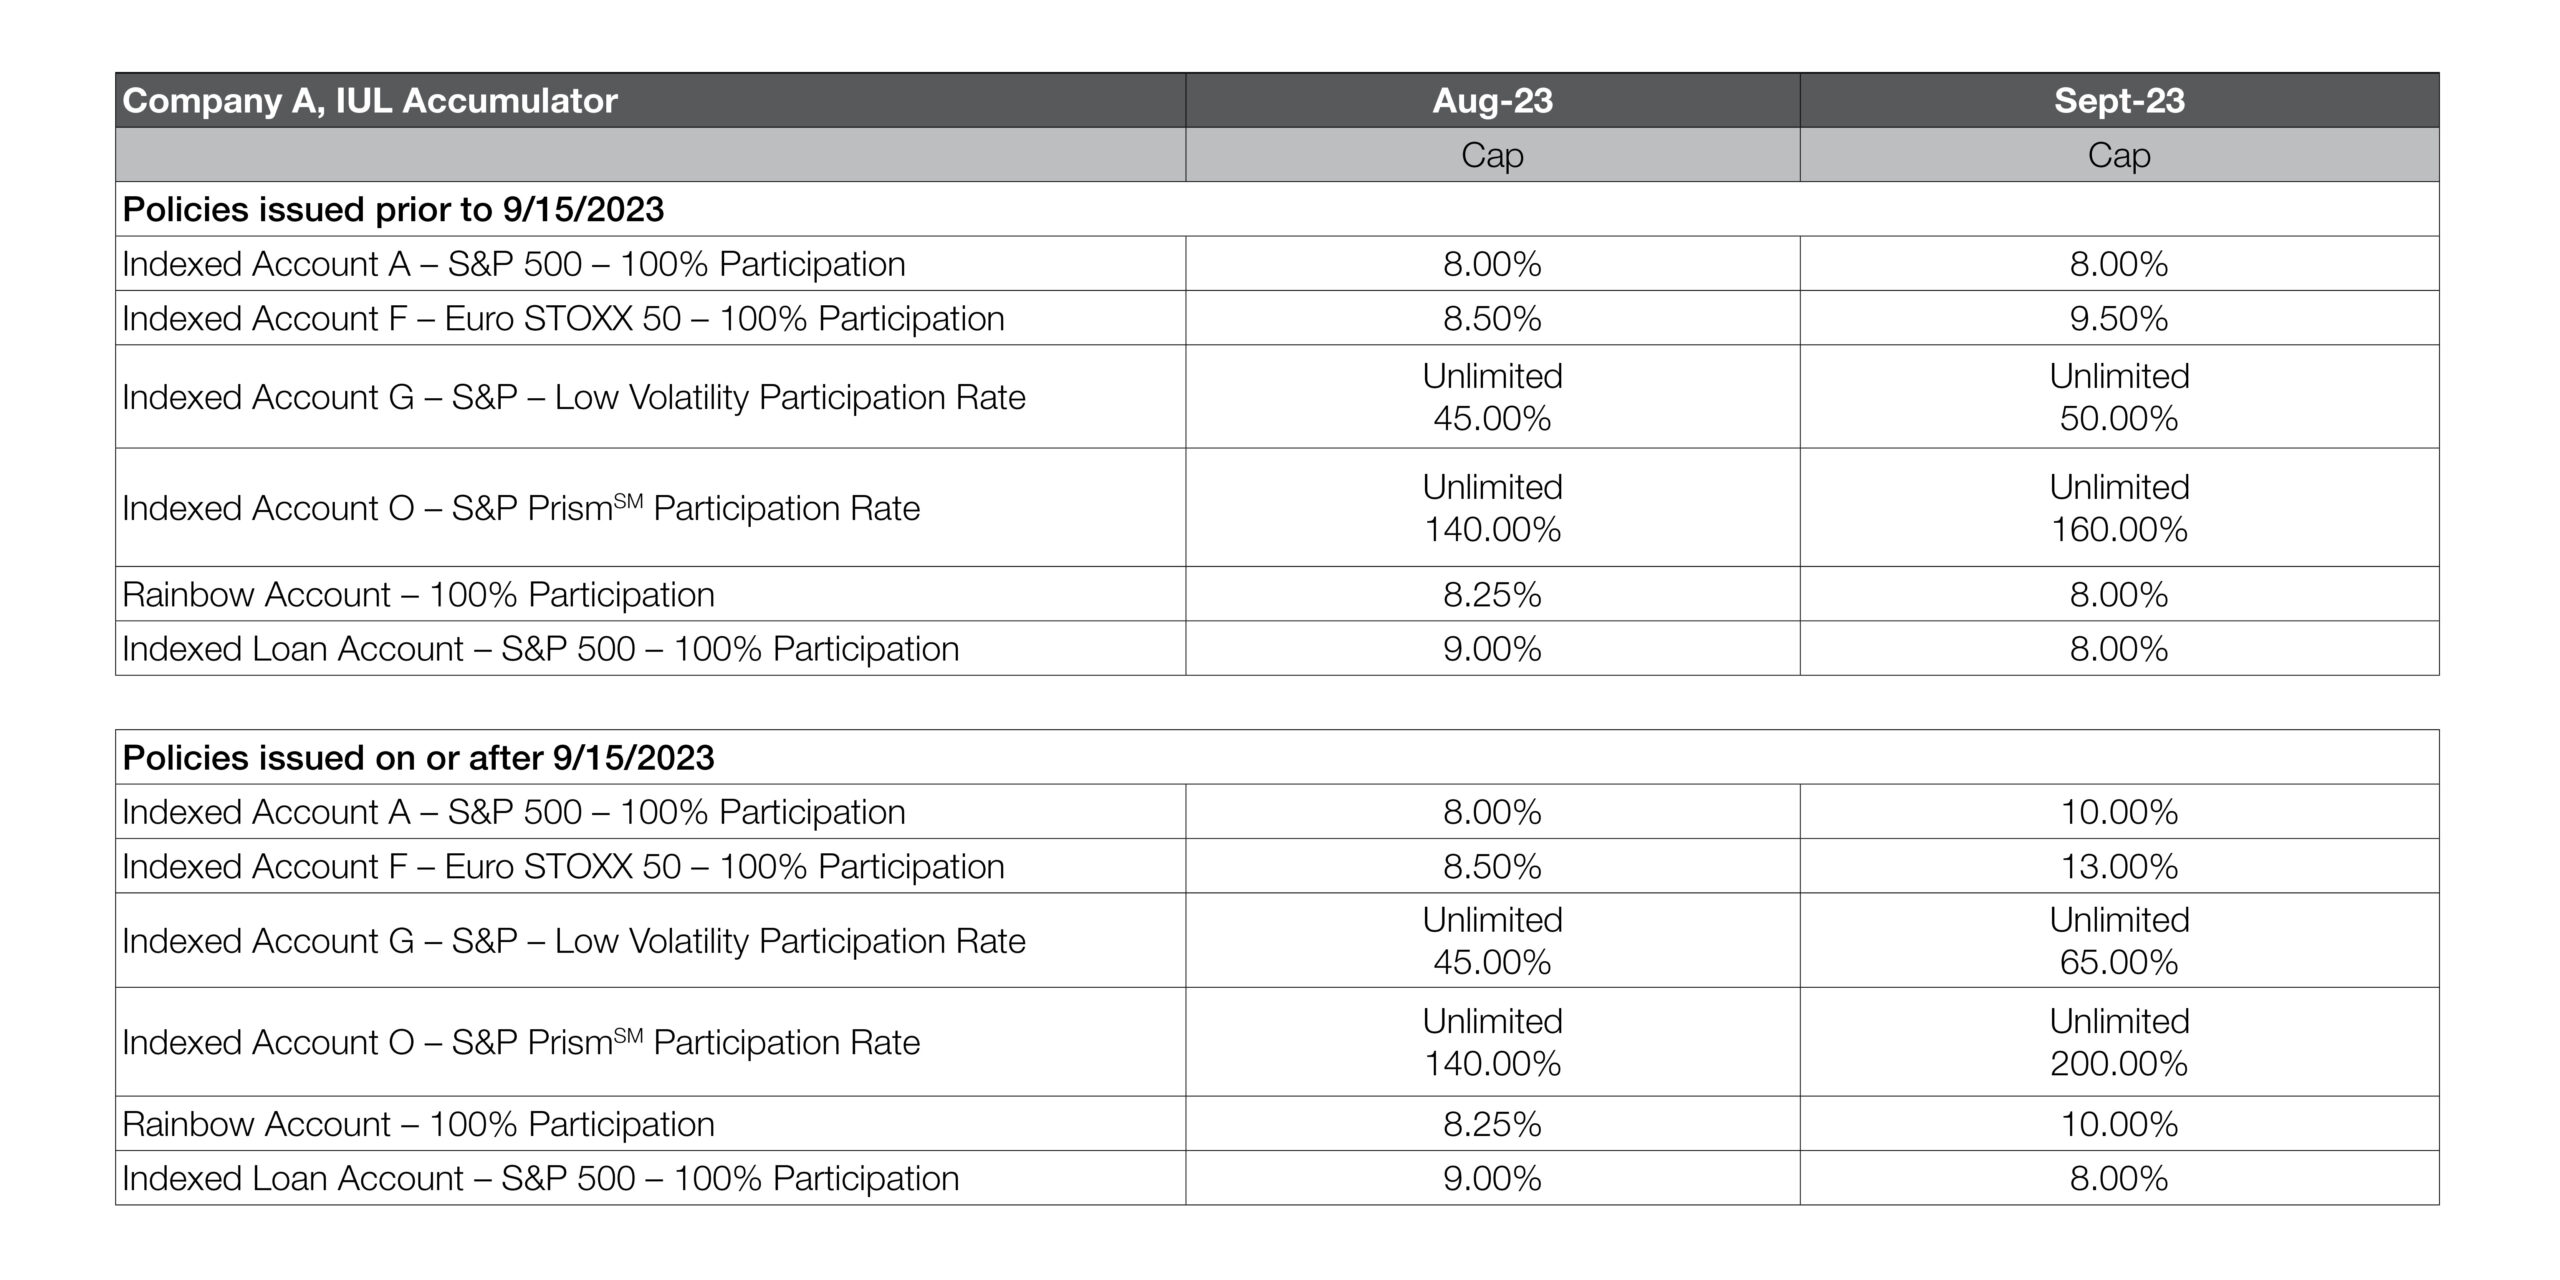
Let me be clear: the level playing field for Company A’s inforce products underwent a seismic shift after September 2023, decreasing the relatively consistent 8%, 8.1% and 8% cap rates to 7%, 7.1% and 10% respectively. So, inforce clients suffer, and the next prospective client wins. Illustrated rates on the IUL Accumulator have jumped up to 6.3% on that new attractive 10% cap. The inforce client is now 300 basis points off the next prospective client. The age-old story of how to grow sales by winning the illustration war has come back to roost.
Let’s revisit how Ameritas is handling that same client issued back in 2015. The Ameritas Excel Plus IUL shown in the top comparison that started this whole dialogue is currently being offered an 9.25% cap rate with a 5.92% illustrated rate, 21% less than the 7.5% illustrated rate on August 1, 2015, and 14% less than the 6.86% illustrated rate on September 1, 2015. The latest accumulation focused IUL offering from Ameritas, Growth IUL II, taps out of this illustration war with a 9.50% cap, not able to hang with Company A’s newest hot product, but also only 0.25% different from the Excel Plus IUL inforce cap of 9.25%. That’s what I call keeping promises for all our members, the last 800,000 and the next prospective one.
We treat our in-force policyholders just as well as we treat our new policyholders. See for yourself. Run an in-force illustration. Look at our historical cap and par rates. Compare these with other carriers and their in-force block of business. Who do you trust for the long term?
No one would question that rates have dropped, and cap rates had to suffer through the sustained low interest rate environment. I’ll end this trip down memory lane with a question for you: had you been in this business, writing IUL in 2015 – which product do you wish you’d put your diligent saver client in during that summer of 2015? Which product do you want your next client to be holding in 2035?
Kelly Halverson
Senior Vice President, Chief Actuary and Underwriting, Individual
This information is provided as educational material to help you understand how an index universal life insurance illustration compares to others available in the industry. This data is for informational use only and is not approved for use with clients. Information was gathered from sources believed to be reliable but not guaranteed.
Interested in representing Ameritas?
Discover the advantages we offer industry professionals of all kinds.
